
SPECT3D Visualizer displays results from SPECT3D simulations. During a SPECT3D run, a copy of the workspace is written to the folder containing the results for the run. This file, identified by the default extension of 'swc', is the primary input (or workspace) file for SPECT3D Visualizer.
If SPECT3D Visualizer is started by double clicking the executable, a dialog box will appear allowing the user to browse for a workspace, or select a recently used workspace. Workspaces may also be opened by choosing File | Open, by selecting a recently used workspace from the File | Recent Workspaces menu item, or by associating the file extension '.swc' with the SPECT3D Visualizer application and double clicking on a *.swc file.
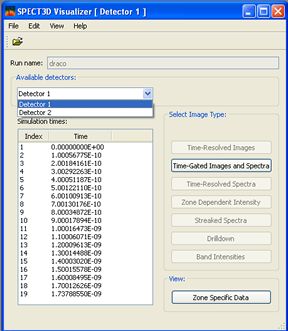
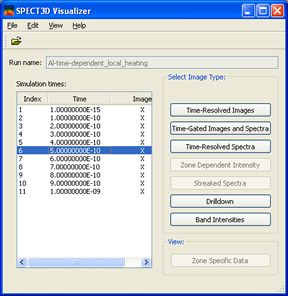
The main window for a multi-time, steady-state calculation is shown below on the left. On the right the main window for a time-dependent calculation is shown. For the time-dependent case, those simulation times for which an image and spectrum are available have an X in the third column. For times with no image or spectrum, only the Drilldown function is available.
If more than one detector was defined in the simulation, the detector for which images and spectra will be shown is selected from a combo box on the main window, as shown in the figure below on the left. The name of the selected detector will be in the title bar of the image windows.
If only one detector is present, the combo box will not be shown, as in the figure below on the right.
| Copyright © 2024 Prism Computational Sciences, Inc. | VISUALIZER 20.5.0 |
